Full System Breakdown
Everything behind the No-HR Score, written out in plain English — what goes in, how it's weighted, when it locks, and how to read the output.
Back to homeWhat the system actually does
No Fly Zone rates every scheduled MLB starting pitcher on a single question and publishes the answer as one number, the No-HR Score. The score is rebuilt from live data all day, ranked highest to lowest, and translated into a plain recommendation so you don't have to interpret the math.
It is not a general "good pitcher" rating. A Cy Young winner can score poorly here and a back-end starter can score great. The model only cares about one narrow, specific outcome — and it is built entirely around that outcome.
The one question we answer
Everything on the site serves that question. The reason we stop at three innings is that it's the cleanest window in a start: the pitcher is fresh, the manager isn't making decisions yet, the bullpen isn't involved, and the pitcher faces the top of the order in a predictable sequence. Beyond the third inning, results get polluted by fatigue, pitch counts, third-time-through penalties and hook decisions the model can't see coming.
A score of 75.6 means the model rates this a very strong chance of a clean first three innings. Scores are published on a 28 to 78 band — deliberately capped so no play is ever presented as a lock.
Step 1 — First-3-inning history
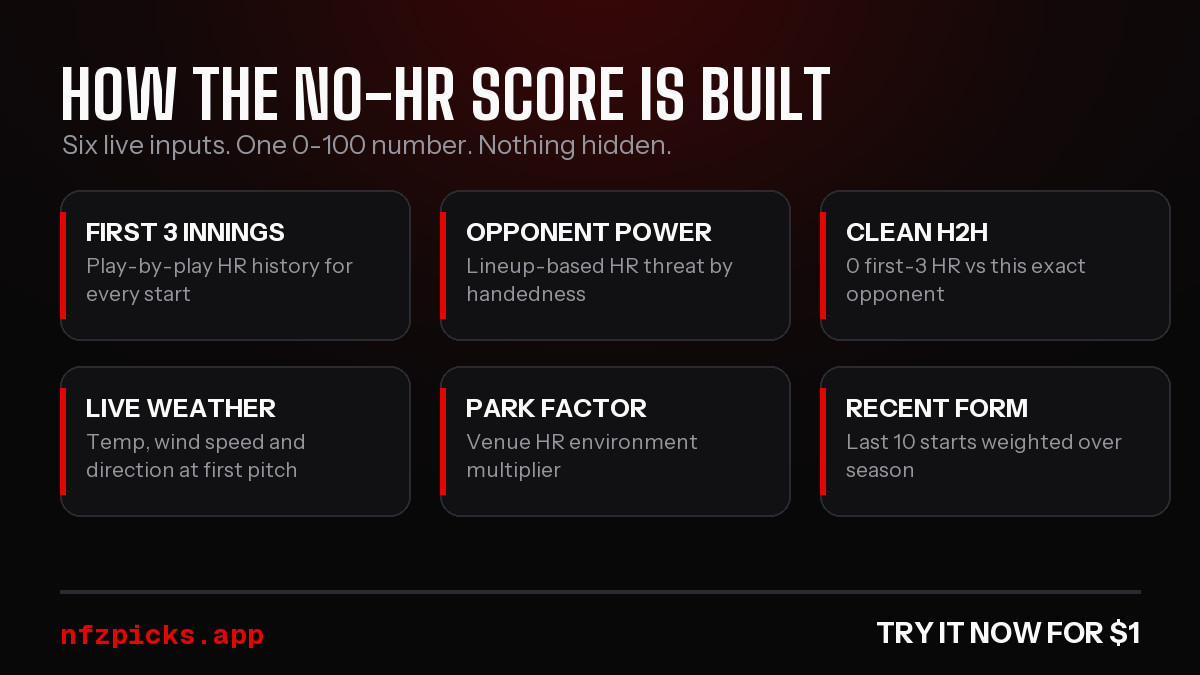
Season ERA and HR/9 describe a whole start. We need the first three innings specifically, so the system reads play-by-play data from the MLB Stats API for every start a pitcher has made and counts home runs allowed in innings 1–3 only. That's what the red pill on each card is telling you: "2 HR in First 3 Inn. | 18 starts (play-by-play)".
Raw counts on small samples lie, so the season home-run rate is regressed toward league average on a 45-inning prior. In practice that means a pitcher with four clean starts isn't treated as un-hittable, and a pitcher with one bad blow-up isn't buried. As real innings accumulate, the prior fades and the pitcher's own numbers take over.
A start only "grades" if the pitcher actually pitched enough of it. A two-inning rain-out or an opener isn't a fair sample of a first-three-inning skill, so those are excluded from the rate.
Step 2 — Recent form beats season stats
A pitcher in April is not the same pitcher in August. The model weights the recent sample (last 10 starts) at 55% against the full season at 35%, renormalized, so form dominates but history still anchors it.
Recent form is measured as a binary rate, not a home-run total: each recent start counts as a 1 (allowed at least one HR in innings 1–3) or a 0 (clean). This matters. A pitcher who gave up three homers in one disastrous first inning and was clean in his other nine starts is a fundamentally different bet than a pitcher who leaked one homer in three separate starts — even though both have "three HR". Totals are shown on the card for context, but they never feed the rate.
Two adjustments ride on top: a contact adjustment using recent strikeout and hit rates (missing bats suppresses homers; getting squared up inflates them), and a consistency bonus tied to the share of clean starts in the recent sample.
Step 3 — Environment: park, wind, temperature
Same pitcher, same opponent, different ballpark is a materially different bet. Each stadium carries a home-run park factor that scales the expected rate up or down.
Weather comes live from Open-Meteo at the ballpark's coordinates for the scheduled first-pitch hour. Wind direction is compared against the actual orientation of the stadium to classify it as Blowing Out, Blowing In, or Crosswind — a 12 mph wind is meaningless until you know which way the park is pointed. Blowing out raises the expected HR rate roughly 0.9% per mph, blowing in lowers it by the same, capped at ±12% so no single gust can swing a rating. Temperature moves the rate about 0.35% per degree away from 70°F, because warm air carries the ball.
Domes and closed roofs are treated as neutral.
Step 4 — Opponent power
The baseline opponent rating combines the opposing team's season home-run production and OPS, normalized across the league onto a compressed 55–80 power scale, then converted into a multiplier of roughly 0.88 to 1.14 on the expected home-run rate. Facing the league's best power lineup is worth about a 26% swing versus facing the weakest.
The scale is deliberately compressed. There are no truly harmless MLB lineups, and the model refuses to pretend otherwise.
Step 5 — The probability engine
All of the above collapses into one expected number of home runs across three innings — lambda:
That's fed into a Poisson distribution, which answers "given this expected rate, what's the probability of exactly zero events?" — the standard model for rare, independent occurrences like home runs.
That raw probability is then shaped into the published score and nudged by pitcher quality signals: strikeout rate (up to ±6 points), WHIP and ERA penalties when they're bad, the consistency bonus, and a small penalty for pitchers with fewer than eight graded starts, because thin samples deserve less confidence. The result is clamped to the 28–78 band.
Step 6 — Lineup + platoon blend (30%)
Season-long team ratings assume the whole roster plays. It doesn't. Once the actual or projected lineup is posted, the system replaces the team rating with a lineup-specific power rating built from the nine hitters who are actually in the box.
Each lineup's home-run threat is weighted across three sources:
- 55% — the platoon split that matches the starter's hand. A lefty starter is judged against those hitters' numbers vs LHP, a righty against vs RHP.
- 30% — season totals, so the full body of work still counts.
- 15% — last-15-game form, so a lineup that's currently hot isn't rated on cold April numbers.
Splits below a minimum plate-appearance threshold are ignored rather than trusted, and the weights renormalize across whichever sources actually have a usable sample.
On top of that sits Platoon Edge, a 0–100 rating where 50 is neutral. High means the lineup does its damage against the other hand, so today's starter is a favorable matchup. Low means this lineup specifically punishes his handedness.
A neutral lineup leaves the number untouched. An extreme one moves it by up to about nine points — enough to change the tier, which is the whole point.
This layer is on by default everywhere on the dashboard: every score and ranking you see is lineup-adjusted, including the Top 2. The Lineup Adjusted toggle lets you switch back to the season-long team power rating if you want to compare the two reads, and your choice is remembered.
Step 7 — Clean head-to-head (25%)
The last layer is the most specific signal available: what this pitcher has actually done in innings 1–3 against this exact team this season.
- Clean H2H — zero first-3-inning homers against them. One clean start is a positive; two is stronger; three or more is the strongest reading the factor gives.
- Burned H2H — homers allowed to them early. The factor drops sharply in proportion to homers per start.
- No meeting this season — the factor is skipped entirely and the score passes through untouched. No sample, no opinion.
One important interaction: if a pitcher has allowed any first-3-inning home run to today's opponent this season, he is capped at Caution no matter how good the score is. A hitter who has already gotten to him early gets to keep that credit.
Tiers: Elite, Strong, Caution, Avoid
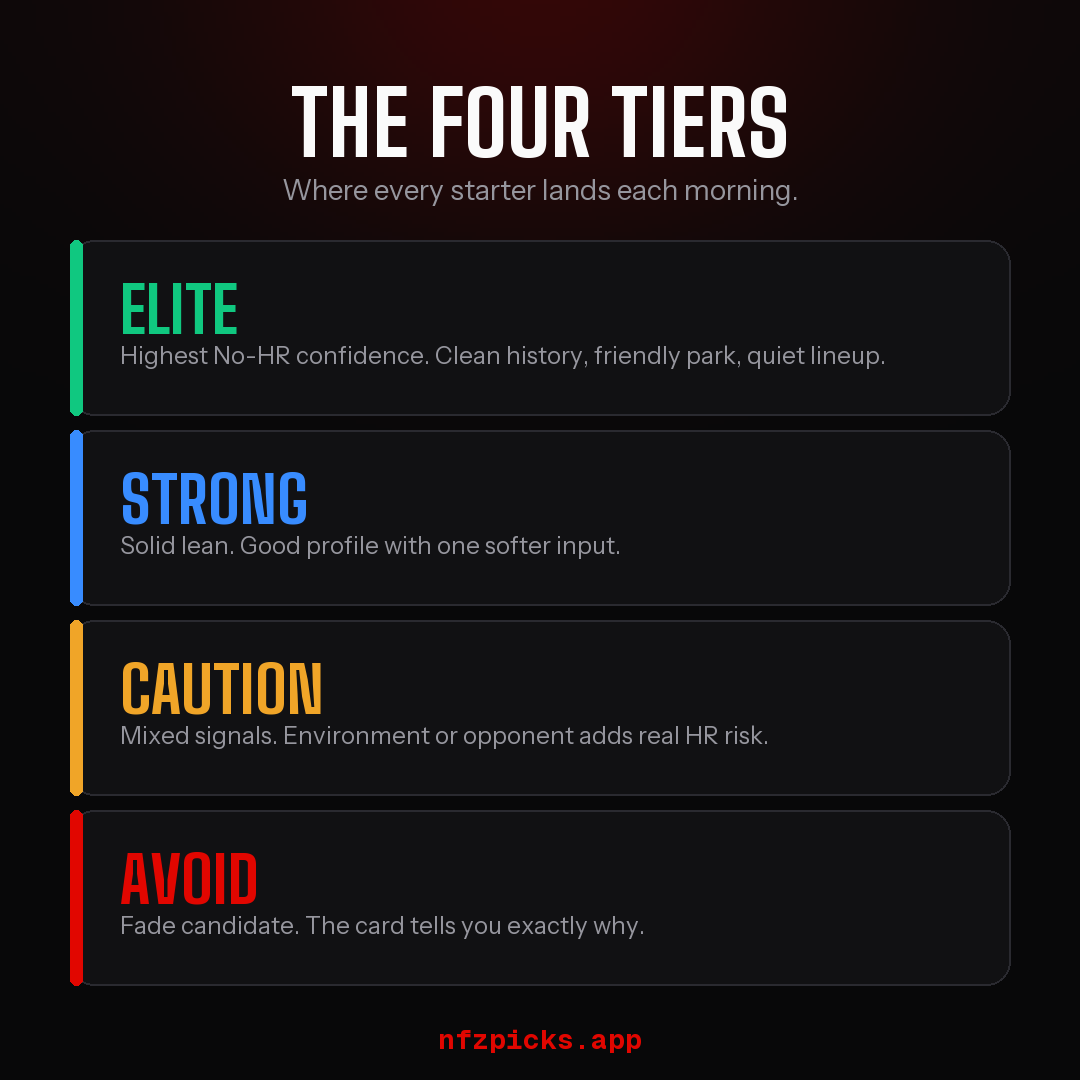
The final score maps to one of four labels:
Top 2 Plays and the lineup lock
The dashboard surfaces Top 2 Plays — the two highest-rated, qualified starters on the slate. Qualification is stricter than the tier alone: a pitcher who has allowed four or more early homers across his last ten starts is disqualified from the Top 2 regardless of score, and if the slate can't produce two qualified plays the system backfills with the next-best available.
Because every score is lineup-adjusted by default, the Top 2 can shift through the morning as projected lineups firm up and weather updates. The moment every game on the slate has its real batting order posted by MLB — not a projection — the selection locks for the day and does not change again, no matter what happens afterward. There is no clock involved anymore: confirmation is the trigger. That's what makes the historical record honest — you can verify what was published before the games, not after.
Each Top 2 play has a "See Why" breakdown that opens the full reasoning behind that specific number.
Live updates and the lineup freeze
Pitcher cards refresh on their own roughly every 5 minutes — new weather, new lineups, scratched starters, updated stats. The green indicator on the dashboard tells you the feed is live.
While a game's lineup is still a projection, that card is fully live: the score and tier are recomputed every cycle against the newest lineup, weather and stats. This is the window where a card can legitimately drift between tiers.
Once MLB confirms that game's batting order, the card freezes to the snapshot taken at confirmation — the score, the opponent power, the platoon edge and the Elite/Strong/Caution/Avoid label are final. Weather keeps refreshing on the card for information, but it no longer moves the score or the tier. A card that somehow never gets a confirmed lineup still freezes at warmup as a backstop, and nothing can be revised once a game is underway or finished.
Games that have gone final stay visible on the dashboard for the rest of the day. The slate only rolls over to tomorrow after the last game of the day ends.
Fades
Not every read is a play for something. Pitchers the model rates Avoid are the inverse signal: situations where an early home run is materially more likely than the market treats it. The Fade toggle on a card lets you track those the same way, and they are kept entirely separate from the Top 2 record so the two never get blended into one misleading number.
The Lineup tab
The Lineup tab shows the actual or projected lineup behind every game on the slate, hitter by hitter — home-run rate against left-handers and right-handers, season production, and recent form. It's the raw material behind the lineup blend, exposed so you can check the model's work instead of taking the number on faith.
Past Performance and the backtest
Past Performance replays the entire 2026 season through the same engine, using only information that was available before each game started, and shows what the system published day by day. Every completed day displays exactly two selected legs, and results are graded on the real outcome: did the starter get through three innings without allowing a home run?
It updates itself. An automated job runs after midnight Eastern each night, pulls in the games that finished the prior day, and grades them — no manual entry, no retroactive editing.
The filters let you interrogate the record rather than just look at it: minimum score, recent early-HR limits for Elite plays, wind conditions, park factor, opponent power, recent strikeout rate. You can ask "how does this system perform on Elite plays only, in neutral parks, with no wind blowing out?" and get a real answer.
How to read a pitcher card
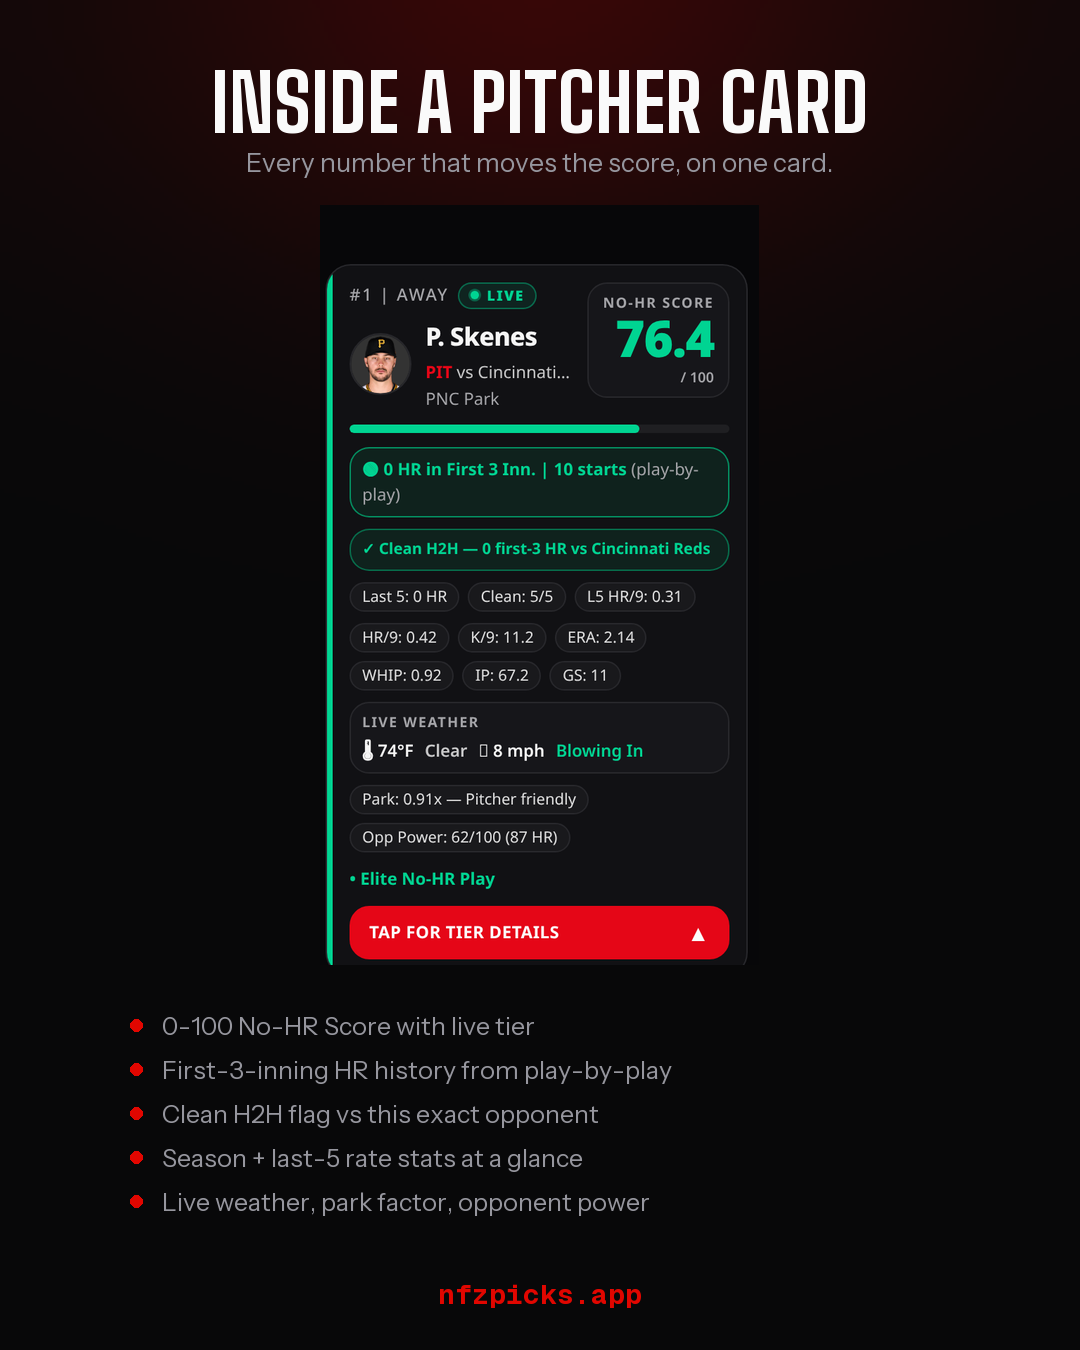
- The big number — the final No-HR Score after every layer, including the lineup and H2H blends.
- The red pill — first-3-inning homers allowed and how many starts of verified play-by-play that count is drawn from. Always check the sample size before trusting the rate.
- RHP / LHP badge — the starter's hand, which drives which platoon split the lineup is judged on.
- Stats row, park, weather, wind — the environment inputs, shown so you can see exactly what the model saw.
- Clean starts chip — clean first-3-inning starts out of the recent sample. This is the fastest read of current form on the card.
- Recommendation label — the tier.
- Details — opens the full breakdown: every factor, the opposing lineup, and the game-by-game log.
What the system will not do
It will not tell you a play is guaranteed. The score is capped at 78 for that exact reason — the model has never seen a first three innings it considers safe.
It does not model everything. Umpire tendencies, in-game injuries, a pitcher hiding soreness, a catcher change, a lineup posted and then scratched an hour later — some of that is unknowable before first pitch, and the model doesn't pretend otherwise.
It does not chase. Scores are not adjusted after the fact to look better, ratings freeze on lineup confirmation, and the Top 2 lock once the slate is confirmed. What you see in the record is what was published.
This is a research and information tool. It's built to give you a defensible, repeatable read on one narrow question — the rest is your call.
Full dashboard access. See today's slate scored end to end.